THE cost of feeding Santta on Christmas Eve has risen by almost 40% over the last ten years.
Experts at Ailsa analysed how much it costs to leave a pint of milk, a mince pie, and a carrot out for Santa and Rudolph on Christmas Eve.
Using supermarket data, they calculated the average cost of each item: a pint of milk is 85p, a pack of mince pies is £1.25, and a 500g bag of carrots is 49p.
They then ran the figures through the Bank of England’s inflation calculator to see how the price has changed over time.
This Christmas Eve, families are expected to spend around £2.59 on the tradition.
But in 2015, it would have cost just £1.86 – that’s a 39% rise over the past decade.
In fact, the biggest monetary jump was between 2015 and 2025, rising by £0.73, while the biggest percentage rise came between 1975 and 1985, when prices jumped by 151.5%.
The tradition of leaving treats out for Santa became popular in the 1930s. Back in 1935, families would only be spending 0.05p.
Overall, the cost of keeping Santa fuelled on Christmas Eve has increased by just over 5,000% over the past 9 decades.
Year
Amount (£)
1935
0.05
1945
0.07
1955
0.11
1965
0.15
1975
0.33
1985
0.83
1995
1.25
2005
1.45
2015
1.86
2025
2.59
“Yes, the cost of keeping Santa fed has shot up but that just proves how determined we are to keep the Christmas dream alive,” said Kane Taylor from Ailsa, who conducted the research.
“Even when the world feels a bit heavy, we still leave out the milk, mince pie and carrot with a smile, because the magic matters.
“For kids, it’s a moment of pure wonder. For the rest of us, it’s a chance to reconnect with the part of ourselves that still believes in something sparkly. If paying a few extra pennies means keeping that glow going, then we’ll happily keep topping up Santa’s snack station.
“In the end, Christmas isn’t about the cost, it’s about the cheer. So, if the price of mince pies keeps rising, we’ll just keep rising to the occasion.
“After all, nothing keeps our spirits higher than keeping the magic alive.”
Evidence to date indicates high food price inflation has not been driven by weak retail competition, but competitive pressure is important as input prices fall
Next phase of CMA probe will examine competition and prices across the supply chain for the product categories identified
Rules on unit pricing should be tightened and retailers must comply to help shoppers compare prices easily
The Competition and Markets Authority (CMA) has today published an initial update on its ongoing work to tackle cost of living pressures in groceries with the publication of two reports: an assessment of retail competition in the groceries sector and a review of unit pricing practices across major retailers.
At a time when food and other grocery prices are rising it is crucial that people can be confident that competition is working effectively to keep price rises as low as possible and that people can shop around and compare prices easily and with confidence.
Groceries
Over the past two months, the CMA has assessed how retail competition is working in the UK grocery sector, particularly between supermarkets such as Asda, Morrisons, Sainsbury’s and Tesco as well as discounters, including Aldi and Lidl. Looking at the effectiveness of retail competition across the market, this stage of the CMA’s review has focused on the extent to which rivalry between retailers ensures they keep their prices as low as possible and whether consumers can shop around to get the best deals.
Although food price inflation is at historically high levels, evidence collected to date by the CMA indicates that competition issues have not been driving this.
In particular:
Operating profits in the retail grocery sector fell by 41.5% in 2022/23, compared with the previous year while average operating margins fell from 3.2% to 1.8%. This is due to retailers’ costs increasing faster than their revenues, indicating that rising costs have not been passed on in full to consumers.
Consumers are shopping around to get the best deals, and the lowest-price retailers – Aldi and Lidl – have gained share from their competitors. This suggests retailers are restricted in their ability to raise prices without losing business.
However not everyone is able to benefit fully from strong competition, particularly those who cannot travel to large stores or shop online, and therefore may rely on higher-priced convenience stores.
Now that some input costs are starting to fall, there are some signs that grocery retailers are planning to start rebuilding their profit margins. The CMA will monitor this carefully in the months ahead, to ensure that people benefit from competitive prices as input costs fall.
The CMA’s review so far has focused on overall indicators of effective retail competition. It has not yet examined competition for individual product categories or across the wider grocery supply chain. This will be an important focus for the next phase of its work. Today’s update identifies 10 indicative product categories (including milk, bread, and baby formula) that merit further analysis to gain a deeper understanding of competition and price dynamics. Our choices are not an indication of any provisional concerns that competition for these products is ineffective.
As part of its ongoing work, the CMA could make recommendations to address any competition issues it finds or take a closer look at any areas which justify further scrutiny.
Unit Pricing
At a time when shoppers are looking for the most competitive deals, unit pricing provides critical information to ensure people can compare prices effectively.
The review looked at 11 supermarkets and 7 variety retailers (stores that sell homeware and household goods with a more limited range of groceries) that operate in the UK .
The CMA has found compliance concerns with the Price Marking Order (PMO) amongst all those it reviewed, however for some retailers these were relatively minor. The CMA has identified that compliance is worse amongst some variety retailers.
Some of the problems stem from the unit pricing rules themselves, which allow unhelpful inconsistencies in retailers’ practices and leave too much scope for interpretation. As a result, shoppers may be finding it hard to spot and compare the best deals.
The CMA’s concerns relate to:
Consistency – different measurements are being used for similar types of products, making it hard for consumers to compare deals on a like-for-like basis. For example, tea bags being priced per 100 grams for some products and others being unit priced per each tea bag.
Transparency – missing or incorrectly calculated unit pricing information both in store and online. For example, 250ml handwash costing £1.19 but unit priced at £476.00 per 100ml and unit pricing information unavailable online until items were selected.
Legibility – unit pricing information being difficult to read, for example text on labels being too small or shelf edge labels being obscured by promotional information or by shop fittings.
Promotions – some retailers not displaying unit prices for any products on promotion.
In its report, the CMA has set out recommendations on the unit pricing rules and is calling on the government to reform this legislation, to help shoppers spot the best deals. The CMA has also written to those that are not fully complying with the PMO and expects them to make changes to address its concerns or risk enforcement action.
More broadly the CMA is calling on all retailers to give consumers the unit pricing information they need to make meaningful comparisons, particularly for products on promotion, even before any reforms to the PMO are introduced.
The CMA will publish the findings of its consumer research into the use of unit pricing in Autumn 2023.
Sarah Cardell, CEO of the CMA said: With so many people struggling to feed their families, it’s vital that we do everything we can to make sure people find the best prices easily.
“We’ve found that not all retailers are displaying prices as clearly as they should , which could be hampering people’s ability to compare product prices. We’re writing to these retailers and warning them to make the necessary changes or risk facing enforcement action . The law itself needs to be tightened here, so we are also calling on the government to bring in reforms.
“We’ve also looked at how competition is working across the grocery retail market more widely. The overall evidence suggests a better picture than in the fuel market, with stronger price competition between all of the supermarkets and discounters. In the next phase of our work, we will examine competition and prices across the supply chain for the product categories we’ve identified.
“We’ll also continue to monitor the situation to ensure that competition remains effective as input costs start to fall.
More information and full reports can be found on our
The big economic news this week was undoubtedly the 12th consecutive rate rise from the Bank of England (writes Fraser of Allander Institute’s MAIRI SPOWAGE). The Bank have done this to continue to bear down on stubbornly high inflation, which is still in double figures at 10.1% (latest data for March).
The Bank’s outlook for the UK economy has improved considerably since their last set of forecasts were published in February. Broadly in line with the Office for Budget Responsibility, they now think that the UK economy will overall be flat in the first half of 2023 before returning to growth in the second half of the year.
The Bank are forecasting 0.7% growth in 2023, followed by 0.8% growth in 2024. It is worth highlighting though that this figure for 2024 is pretty anaemic, and below the current forecast from the OBR for the same period.
The Bank’s expectations are still for inflation to fall sharply from April, in part as the high price levels from a year ago come into the comparison. The next data are out on 24th May: let’s see if the economists are correct this time, as to be fair we’ve all been expecting the rate to fall below 10% for some months now.UK
Economy grows in Q1
Today, we got data from the ONS that confirms that the UK economy grew during the first quarter of the year, albeit by only 0.1%. That is balanced out with the news from the monthly data that there was a contraction during March, with wholesale and retail contributing the most to this contraction. This could suggest that the wider economic conditions are starting to bite on consumers, so it will be interesting to see how this is reflected in next month’s data.
Reports about talks about talks
Officials from the Scottish Government and HMRC were at the Public Audit Committee this week to give evidence about the administration of Scottish Income Tax. This session, as one may expect from the Public Audit Committee, was on the technical details of the collection of the tax (which, while partially devolved, is collected by HMRC rather than Revenue Scotland) and also the audit arrangements for the tax collection.
There were some interesting nuggets in there from a tax policy perspective. There was the view of the Scottish Government on the reasons for Scottish Income tax lagging behind the rest of the UK: mainly laid at the feet of the decline in oil and gas jobs: but there didn’t seem to be much clarity on whether we would ever be able to analyse whether this was actually the case.
We also heard that the fiscal framework review has moved “back into an active space”. For those who are after a recap of what on earth this is all about, see our blog in late 2021.
Slightly depressingly, as the PAC Convener Richard Leonard characterised it, this review is currently in the status of “talks about talks”. It is still very unclear when this may be concluded (or even start). Hopefully, we’ll see some news about this from both Governments soon.
This week always feels like a bit of a transition every year – it starts to feel a bit late to say “Happy New Year”, and the start of the week is dubbed “Blue Monday” as people realise that those well-meaning new year resolutions have already been broken (writes Fraser of Allander Director MAIRI SPOWAGE).
One of mine was to think hard to find the optimistic news in what can sometimes feel like the unrelentingly negative economic situation we are in, which is likely to remain tricky throughout the year. I was tested hard this week as new inflation data was released on Wednesday.
Inflation falls to 10.5% – but let’s not get too excited
The ONS released the official inflation data for December, which showed CPI inflation had fallen from 10.7% in November to 10.5% in December.
The main items driving the fall in inflation are petrol and diesel prices, and prices for clothing in footwear. Prices at the pump have been falling since their peak in July, and in December they were back to roughly the levels they were at before the Russian invasion of Ukraine. Clothing and footwear has fallen really due to a lack of discounting in December 2021, so when compared to December 2022 it appears that prices have fallen.
Obviously, energy prices are still contributing hugely to this very high inflation rate (which, let’s not forget represents a 40 year high of inflation apart from the preceding three months in 2022). That increase is currently stable in the figures due to the UK Government’s Energy Price Guarantee – but this cap on unit prices is only in place until end March, when it increases to £3,000 for a household with typical use. The ONS estimate that this will add 1 percentage point to inflation when it comes into effect.
Worryingly for those on the lowest incomes, food prices continue to increase faster than the headline rate. The inflation rate for food and non-alcoholic beverages increased to 16.9% in December from 16.5% in November.
We were asked two main questions when the data came out on Wednesday.
The first was, of course – what is the outlook for inflation for the rest of 2023? The expectation by the OBR is that inflation is likely to fall to under 4% by the end of the year. But remember, this does not mean that prices will start to fall at this point – just that they will grow less quickly.
This is somewhat simply due to the definition of inflation – it compares prices now to prices a year earlier, so as we move into October, we will be comparing to the much higher energy costs from October 2022. It was therefore inevitable that growth was likely to slow down – a point to bear in mind when some try to take credit for the fall in inflation.
The second is whether we are likely to see further increases in the Bank of England’s base rate at their next meeting on 2nd February – especially given that inflation has come down a bit. Unfortunately for mortgage payers, it is still very likely that we will see further increases in the base rate.
Why? Because inflation is not just been driven by food and energy costs. CPI excluding energy, food, alcohol and tobacco (often referred to as core CPI) is at 6.3%, and has been around this level since July 2022. This is being generated by domestic factors, including the tight labour market, which means the Bank is likely to take the view that they need to continue to cool demand in the economy.
Scottish unemployment remains at 3.3%
We also got updated figures on the labour market on Tuesday, covering the three months to November. Scottish unemployment remained at 3.3%, slightly below the UK rate of 3.7%. Employment remains high, at 76.1%, with inactivity at 21.3%.
Changes in inactivity over the period of the pandemic have been a focus of much analysis – because although the level is now similar to before the pandemic, the underlying reasons why people are inactive seem to have changed – with an increasing number saying that they are not in work or seeking work because of ill health or disability.
See a great Twitter thread on this by our colleague Professor Stuart Mcintyre – as part of his monthly analysis of the labour market.
Alongside the headline labour market numbers, there is also information ONS publishes monthly on earnings and vacancies.
The vacancy level alongside the labour market data helps us understand how tight the labour market continues to be. The total number of vacancies has been falling in recent months, since the record highs in Q2 2022. However, the number of vacancies remains historically very high, with 1.0 unemployed people for each vacancy – a rate which remains indicative of a tight labour market.
Earnings (ex bonuses) grew by 6.4% in the year to the three-month period Sept-Nov. Given the inflation rate over this period, this means that earnings are continuing to fall in real terms. In the face of continuing public sector pay disputes across the UK, the split between the public and private sectors is particularly interesting. Private sector pay grew by 7.2% compared to 3.3% for the public sector.
Health Foundation publishes important research into health and health inequalities in Scotland
This week the Health Foundation published a report to provide a picture of health and health inequalities in Scotland, in order to inform future efforts to improve both.
An independent review underpins their report, and we were delighted to work with the Health Foundation on this programme of work, as one of four independent organisations to carry out supporting research. See our research here.
And finally, I don’t care if it’s too late – Happy New Year everyone! But that is the last time I’ll say it this year.
A new annual report explores how the significant disruption of last year is setting the market mood of the construction sector in 2023.
Today, Glenigan, one of the construction industry’s leading insight and intelligence experts, releases its 2022 Construction Performance Review.
Providing a topline overview of UK construction sector activity over the past 12 months, this report evaluates overall output whilst offering insight into how this will influence the market in 2023.
Figures presented are drawn from Glenigan’s own data, combining both major (> £100m) and underlying (<£100m) projects, complemented with information from other official sources, including ONS figures.
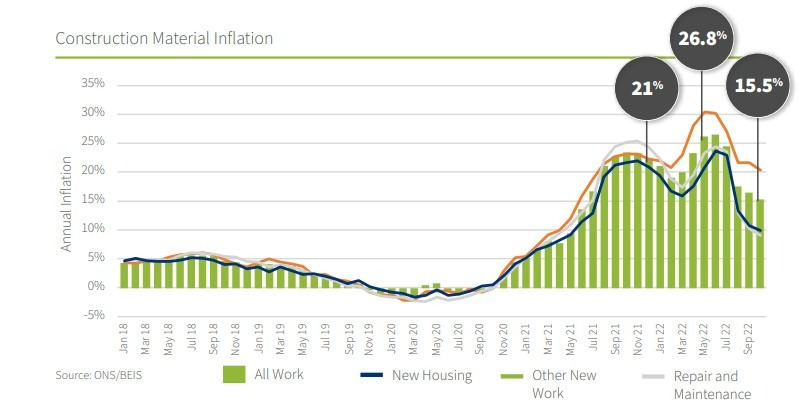
The key takeaway from the Review is the staggering inflation in construction materials costs, which had been gathering momentum since January 2021 to peak at a massive 26.8% in Q.2 2022. Whilst currently figures have settled at around 15%, ongoing international geopolitical events and domestic socioeconomic disruption indicates market volatility and, possibly, another inflation spike in the first half of 2023.
Looking at specific materials categories, energy intensive products were hit hardest, with the price of aggregates and insulation rising an eye-watering 53% and 32% respectively. More barriers to imports post-Brexit and rocketing power prices can be seen as the key reasons for these dramatic rises, and will put considerable pressure on contractors already working to extremely tight margins.
Labour and Wait
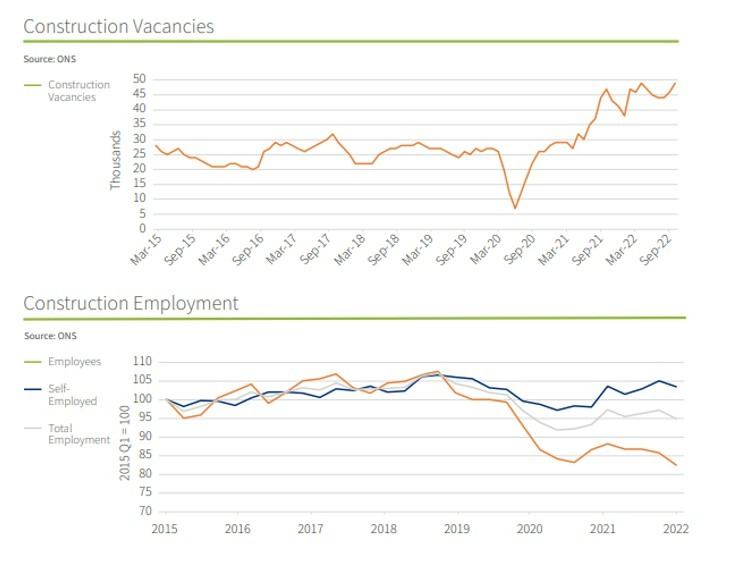
The construction sector also felt the pinch in terms of labour supply, which intensified over the course of 2022. Alongside legacy issues, such as a shallow recruitment pool and a greying workforce, Brexit and the Pandemic has resulted in less ready access to EU workers.
Looking at the figures as they stand at the start of the year, whilst there are currently 2.14 million employed in the sector, this number still languishes almost 7% below pre-Pandemic levels and 2.4% on a year ago. Couple this with 49,000 construction vacancies and there’s a shortfall with the very-real potential to stifle 2023 activity. This might put a serious dent in the current Government’s ambitious infrastructure and levelling-up plans in the short-term.
Projected Performance
Despite material and labour pressures, output actually rose in 2022 by 6% compared to the previous year. Most significant was a 52% leap in industrial new build and 11% registered for private residential new build activity.
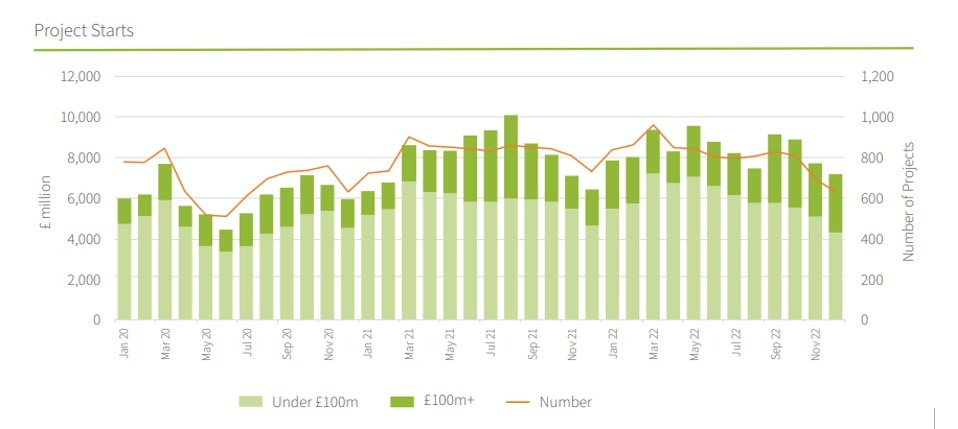
However, tempering any optimism for a speedy recovery, a drop in the number of projects starting on site last year points to a weakening in construction output in 2023.
2022 saw a significant slowdown in projects progressing to work on site, as contractors and clients have reappraised the design and cost of build, largely prompted by price inflation and regulatory changes.
For example, many housing developers pushed back start dates in Q.3 2022, following the introduction of Part L of the Building Code. Overall this has led to a 50% increase in the time it takes from planning approval to commencing on site.
Furthermore, the value of underlying project starts also declined by 5% in the second half of 2022, compared with the same period a year ago. This was reflected in a 5% dip in the value of underlying planning consents during the same period and a concerning 14% drop in the number of projects securing planning consent.
Looking Ahead
Commenting on 2022 performance, and how it relates to the year ahead, Glenigan’s Economic Director, Allan Wilen, says: “The construction sector has already been buffeted by strong headwinds in the second half of 2022, and these look to become more forceful in 2023.
“The cautious optimism and tentative performance increase this time last year has been washed away by events out of the sector’s control, and many businesses will be battening down the hatches and hedging their bets for a potential, if modest, uplift in the latter half of the year.
“Whilst supply side pressures may ease, the skills shortage is a persistent problem which the industry will urgently need to tackle if it wants to return to pre-Pandemic output levels. However, there are a few bright spots in the gloom, with major projects including HS2 driving activity, as well as an increased focus on other critical infrastructure in energy, healthcare and data centre developments.
“Whilst next year will remain depressed, with a 2% decrease in the overall value of underlying project starts, Glenigan predicts a 6% increase in 2024, setting construction back on the road to recovery.”
To read the full 2022 Construction Performance Review Report, containing deeper analysis of the above, click here.
2023 sees Glenigan celebrate its 50th anniversary, commemorating half a century of delivering the highest-quality construction market intelligence.
To find out more about its services and expertise click here.
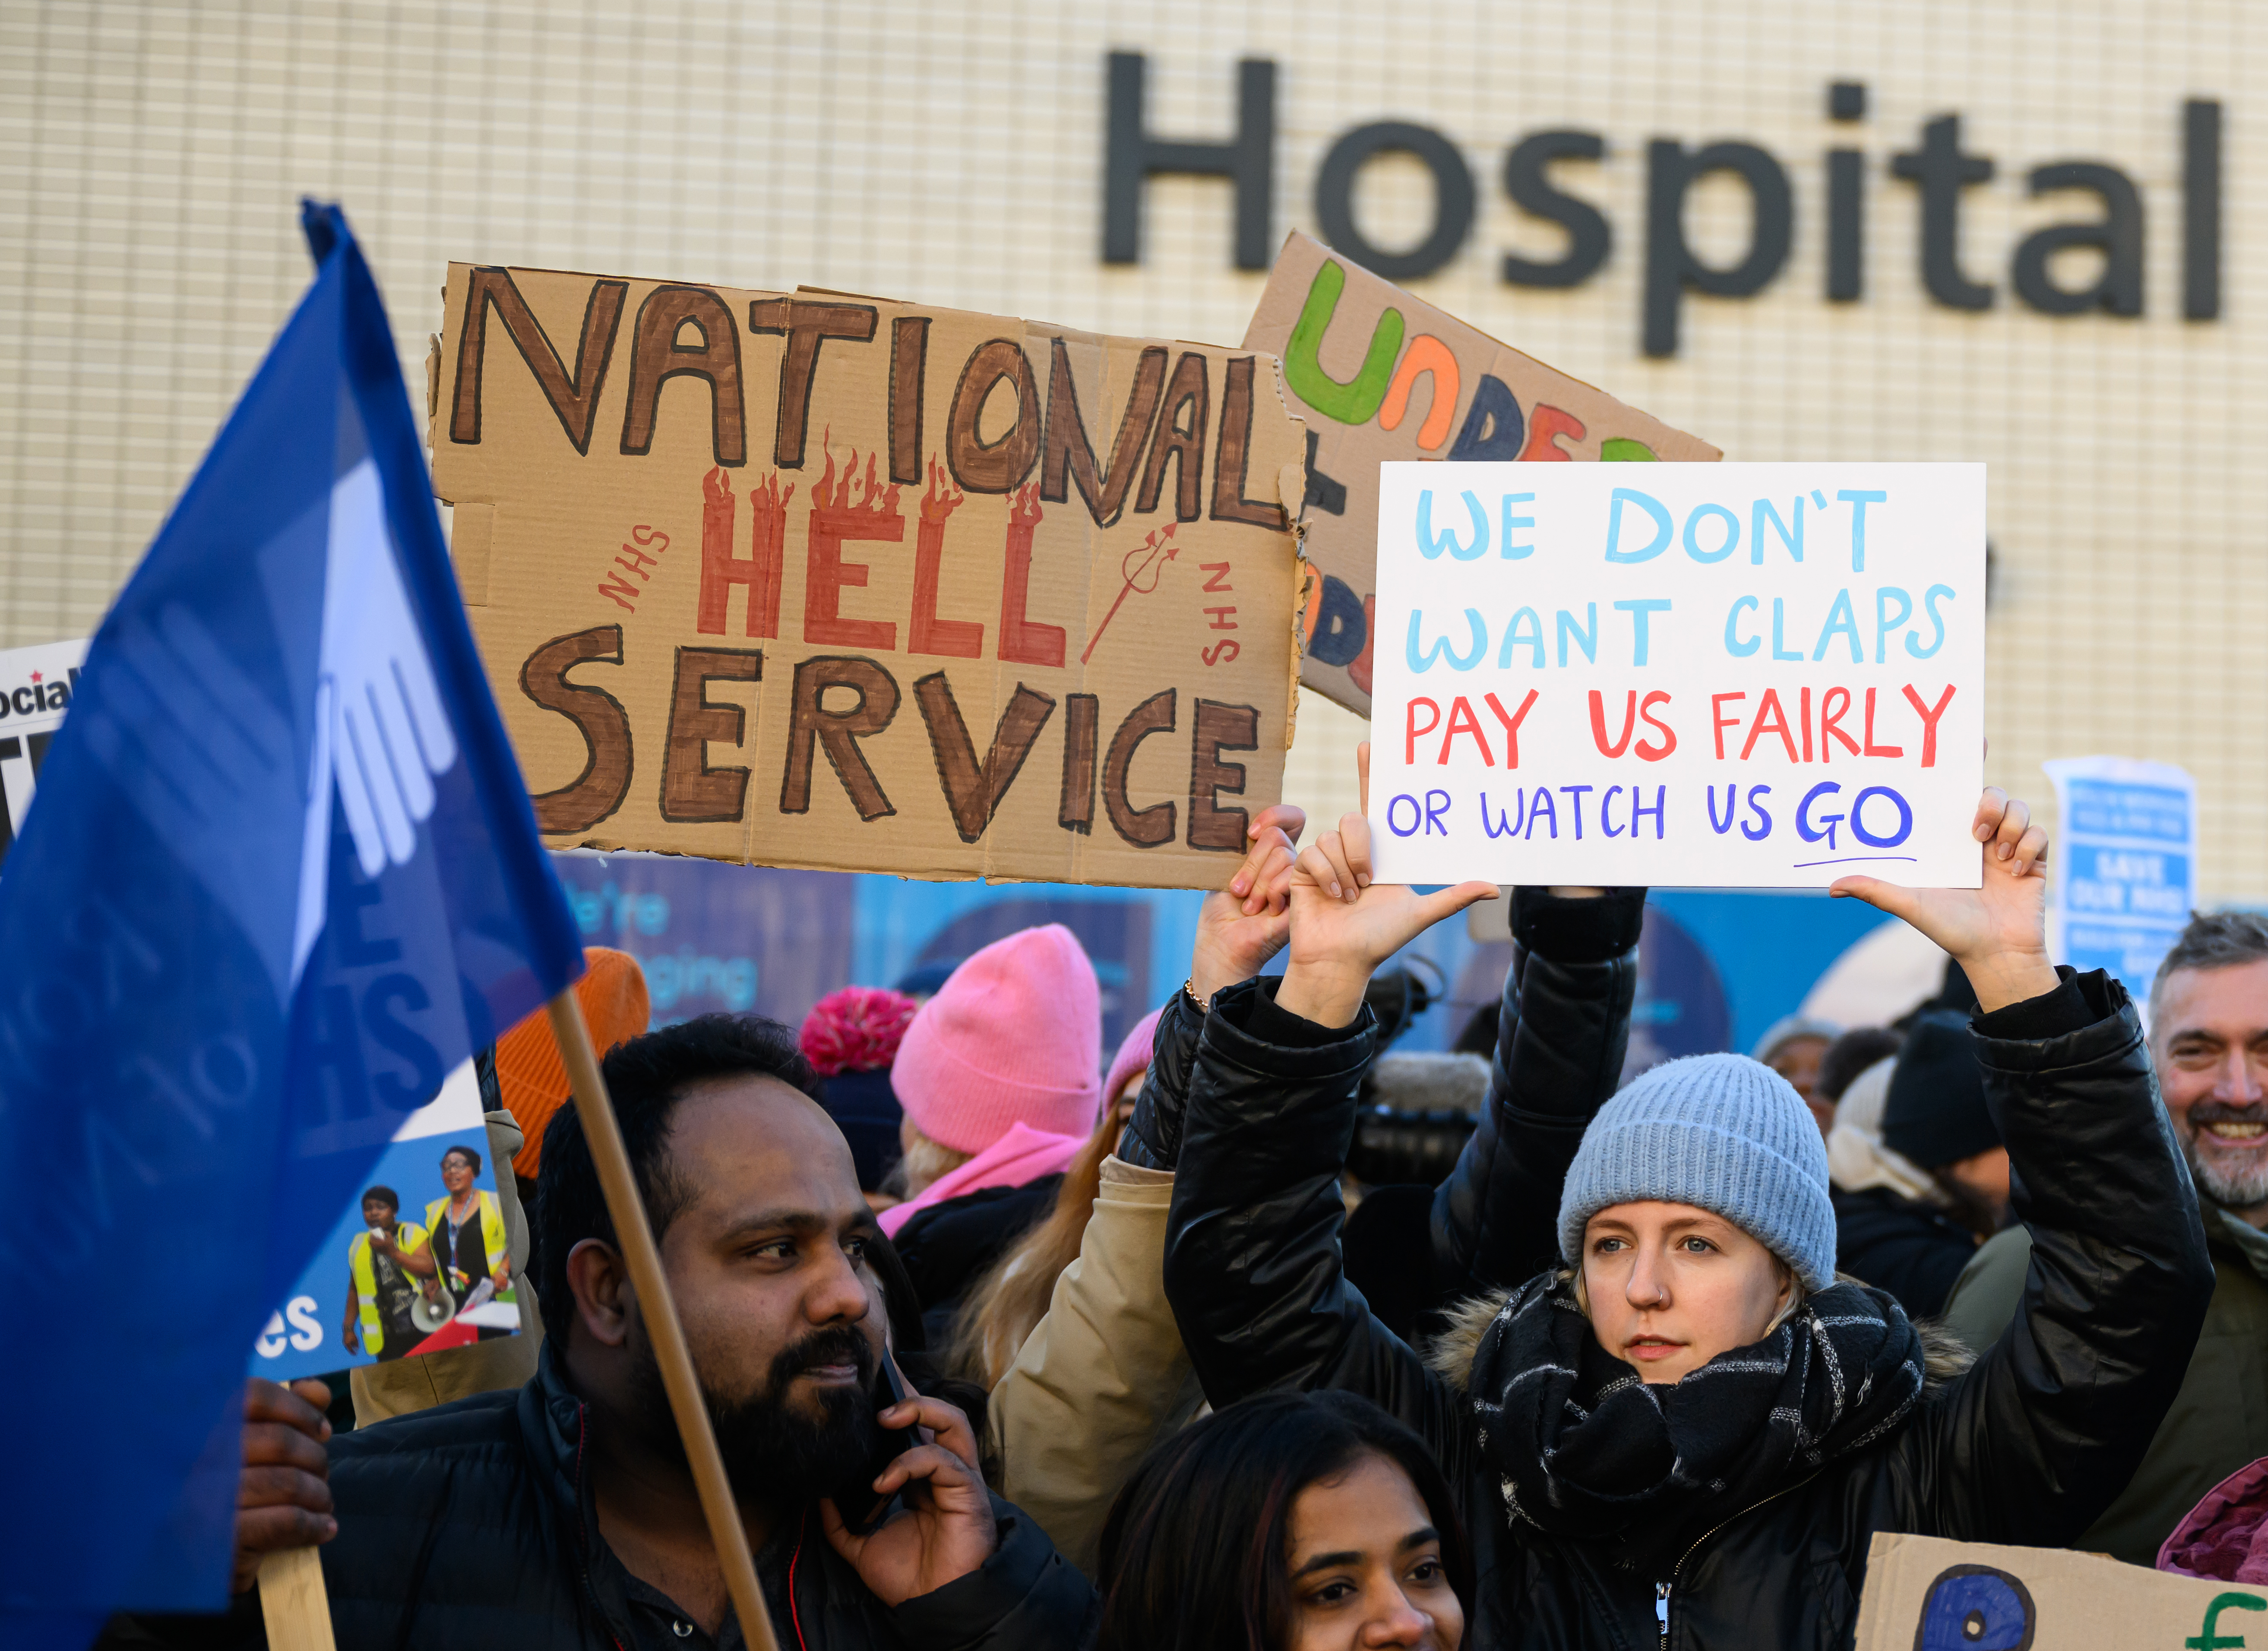
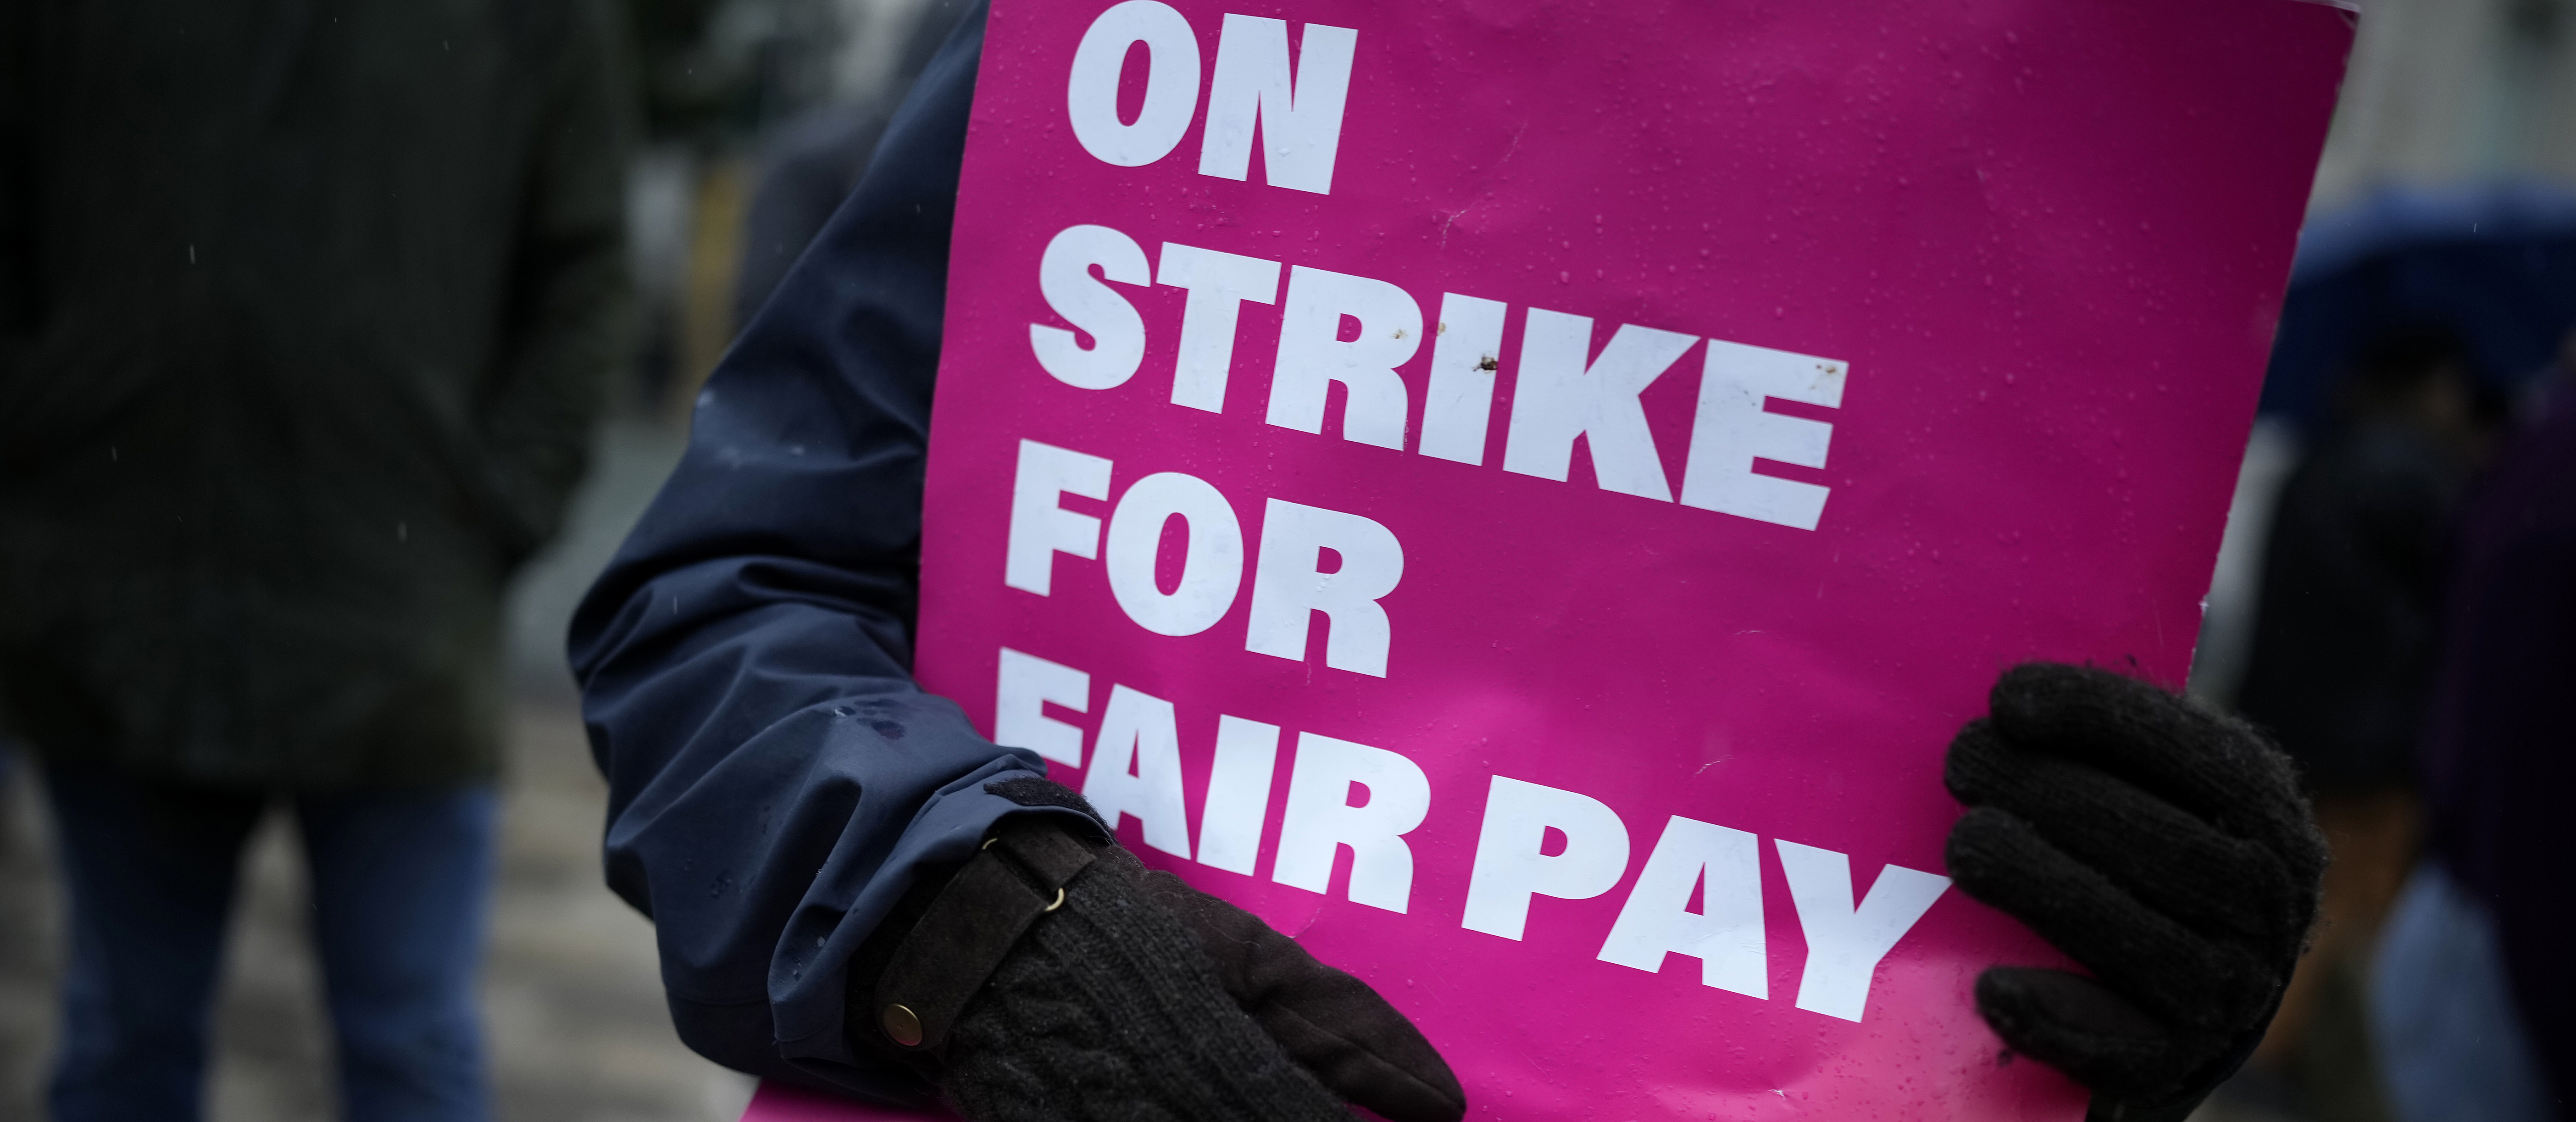
This winter we’ve seen hundreds of thousands of workers taking industrial action – or striking – to defend their pay and conditions (writes TUC’s Alex Collinson).
These are individual disputes, and it’s important to understand the details in different workplaces. But there is a common cause: a pay disaster that means workers are being paid less in real terms now than they were 14 years ago.
First things first – what’s a strike?
Trade unions exist to defend their members’ jobs, pay and conditions. Normally they try to do that through negotiations with employers, through a process called collective bargaining. But when those negotiations break down, workers have the right to collectively withdraw their labour to help bring the employer back to the bargaining table.
In Britain, the right to strike is governed by complex and restrictive industrial action laws. In summary, to count as ‘protected industrial action’, a strike must:
relate to a work dispute with your own employer
be supported by a valid secret postal ballot with independent scrutiny, in which at least of half the balloted workers have voted (in other words, “not voting” counts as a vote against the strike)
be carried out with notice
In addition, since the Tories’ 2016 Trade Union Act strikes involving workers who provide what the government calls an “important public service” can only be lawful if at least 40% of the workers balloted over the action vote in favour of it.
How much has strike activity increased?
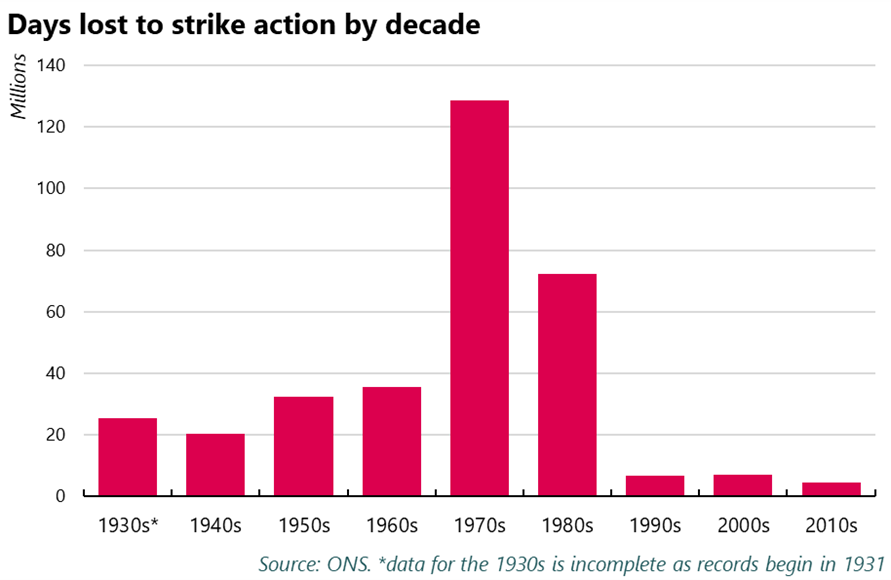
The number of strikes has been on the rise in recent months. The latest data shows that the 417,000 days were lost due to strike action in October 2022, the highest it’s been in 11 years. Some are estimating that this December will see over a million days lost to strike action for the first time since 1989.
But it’s important to put the recent rise in strike action into context. While the number of days lost due to strike action is relatively high compared to the past couple of decades, they’d be fairly standard in any decade before the 1990s.
If more than one million working days are lost due to strikes in December, it’ll be the first time it’s happened since July 1989. But between 1970 and 1989, there were 47 months when this happened. And the 417,000 days lost due to strike action in October 2022 may be the fifth highest on record since 1990, but we regularly saw far higher figures pre-1990.
So what’s behind the rise?
Each individual strike will have different reasons behind it, but there’s some common factors behind the recent rise.
Work has been getting worse for many – lower paid, worse conditions, increasingly insecure. At the same time as workers have seen pay and conditions get worse, businesses have been giving more and more money to shareholders, with dividends paid out to shareholders growing three times faster than wages over the past decade.
And the government has been refusing to properly fund pay rises for public sector workers, failing to introduce a proper minimum wage, and attacking trade union rights, and failing to introduce a proper minimum wage.
The government’s minimum wage remains below the Real Living Wage set by the Living Wage Foundation, and, even with next year’s rise, will be £4.58 below a £15 per hour minimum wage.
Pay
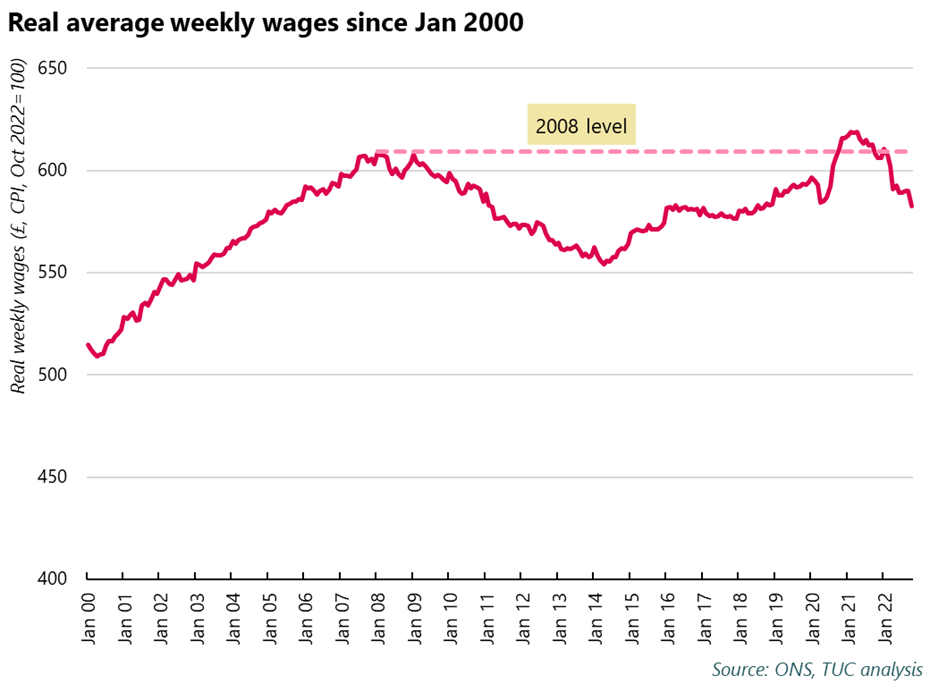
We’ll start with pay. Average real pay (that’s wages once you take inflation into account) is lower now than it was in 2008. It’s not expected to go back above 2008 levels until 2027. This 19-year pay squeeze is longer than any pay squeeze we have official records for, and likely the longest since Napoleonic times.
If wages had grown in line with pre-2008 trends over the past fourteen years, they’d now be £291 per week higher than they currently are.
Over a decade of stagnant pay has directly contributed to the current crisis, leaving many people unable to cope with a sudden rise in prices. While the cost of living crisis is often presented as a recent problem, it’s been building for years.
The situation was already dire before energy bills began to rise. As we went into the pandemic, the number of people in poverty was at a record high, with the majority of those in poverty living in a working household.
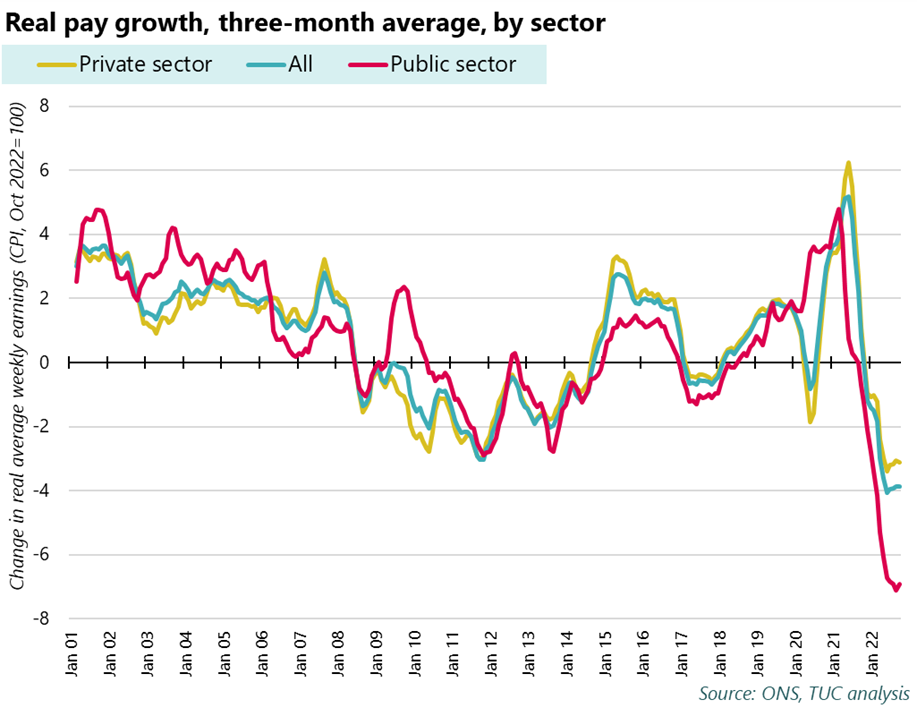
The recent rise in prices has made the situation even worse. After years of stagnant pay, workers are now facing double-digit inflation while being offered single-digit pay rises. The latest data shows that, in October, nominal pay rose by 6.4 per cent, while inflation hit 11.1 per cent. Real pay has fallen by £111 per month in the past year alone.
This is particularly bad in the public sector, where pay is rising by just 3.8 per cent, and average real pay has fallen by £185 per month in the past year.
Weak pay growth in the public sector is down to the government refusing to give proper pay rises to workers that kept the country running during the pandemic. Look at health workers, for example. TUC analysis of NHS pay scales shows that:
Nurses’ real pay fell by £1,800 over the last year
Paramedics’ real pay fell by £2,400 over the last year
Midwives’ real pay fell by £2,400 over the last year
This is after a decade of pay suppression by government that has led to nurses earning £5,000 a year less in real terms than they were in 2010. For midwives and paramedics this rises to over £6,000.
Working conditions and job losses
But it’s not just about pay. Many of the current strikes happening aren’t just about getting pay rising, but also protecting jobs, fighting against worsening working conditions, and putting an end to insecure contracts and outsourcing.
Fighting for pay itself is often a fight to improve working conditions. Better pay helps with recruitment and retention of staff.
It’s a political choice
The government spent months clapping for key workers, but now refuses to give them a fair pay rise. This is a political choice. The government could avoid, for example, rail workers, nurses, teachers, paramedics striking by getting around the negotiating table and offering a decent, fair pay rise.
Instead, it continues to offer real pay cuts to public sector workers, often hiding behind pay review bodies while it does. And when it comes to rail workers, the government is actively blocking deals being made. This is all part of wider cuts to public services that have left them understaffed and underfunded.
The government doesn’t agree pay deals in the private sector, but it can set a positive example to employers by offering decent pay rises. It also has the power to deliver increases to the minimum wage that get it to £15 an hour.
But instead, the government has repeatedly attacked trade union rights, making it harder to strike and therefore harder to negotiate for better pay.
Workers are winning
There’s another reason behind the rise in the number of people gaining confidence to take action: workers are winning. People are winning better pay deals and working conditions by joining together and standing up for themselves. Striking workers have won themselves double-digit pay rises across a range of different jobs, from bus drivers to BT engineers, as well as better conditions and an end to outsourcing.
If you aren’t in a union yet, there’s never been a better time to join – talk to your mates and talk to a union. And to learn more on how the TUC is supporting union disputes, see our solidarity hub here.
Business Activity Index falls to 45.8 in October from 48.0 in September
Contraction in new orders quickens
Growth in employment further weakens
The contraction across Scotland’s private sector firms deepened during October, according to the latest Royal Bank of Scotland PMI® data. Adjusted for seasonality, the Business Activity Index posted below the neutral 50.0 threshold for the third month running, at 45.8, indicating a sharp decrease overall.
Inflows of new business also went into further decline, the latest downturn being the most severe in 20 months. To further add weakness across the sector, inflationary pressures reaccelerated from September’s recent low, as service providers reported quicker upturns in input costs and charges during October.
The gloomy performance resulted to the softest intake of workers in 18 months, with goods producers reporting their first reduction in employment since January 2021.
New business received at Scottish private sector firms fell sharply during October. The rate of decrease quickened from September to the fastest in the current fourth-month sequence of reduction.
Of the two sub-sectors, manufacturing firms reported the steeper downturn. Companies noted that looming recession, economic uncertainty and the cost of living crisis weighed on client activity.
The downturn in incoming new business across Scotland outpaced the UK-wide average.
Output expectations for the year ahead across private sector firms in Scotland strengthened in the three months to October. The increase in confidence was underpinned on planned expansions and investment, with firms also hopeful of future economic stability. That said, sentiment was relatively muted in context of historical data.
Business confidence across Scotland was broadly in line with that recorded for the UK as a whole.
Employment across the Scottish private sector expanded for the nineteenth month running in October. However, amid a cooldown in hiring activity at service providers, with goods producers reporting their first contraction since January 2021, the overall rate of growth ticked down to the joint-lowest in the aforementioned series.
The rate of job creation across Scotland remained softer than that seen at the UK level, which similarly also slowed in October.
October’s survey showed a sustained fall in levels of outstanding business across Scotland’s private sector. The respective seasonally adjusted index posted below the neutral 50 threshold for the fifth consecutive month, the latest reading signalling the fastest depletion in work outstanding since January 2021. As per surveyed businesses, declines in new orders allowed firms to work through previous backlogs.
The rate of contraction in Scotland was the third-fastest across the UK, ahead of Northern Ireland and Wales.
October data signalled a robust rise in input costs across Scotland’s private sector, thereby extending the run of inflation to 29 months. Adjusted for seasonality, the latest reading increased from September’s 13-month low as a result of a reacceleration in input price inflation reported at service firms. The uptick in average costs was attributed to higher wages and utilities, cost of living crisis and general inflation adding strain on costs.
Despite being severe, the pace of input price inflation was however, softer than the UK average.
In line with the upturn in average cost burdens, charge levied by Scottish private sector firms also inclined from September’s recent low at a quickened rate during October.
The rate of charge inflation across Scotland posted weaker than the UK-wide average which slowed during October.
Source: Royal Bank of Scotland, S&P Global.
Judith Cruickshank, Chair, Scotland Board, Royal Bank of Scotland, commented: “The Scottish private sector reported a third month of contraction during October. The downturn in activity quickened on the month, as stubbornly high inflationary pressures, the ongoing cost of living crisis and a threat of recession deterred growth. New orders received at firms also fell further.
“Employment trends across the sector indicated a slowdown in hiring activity over the recent months. The latest upturn was the joint-softest in the current 19-month sequence of expansion. At the same time, the level of outstanding business also fell at a much sharper rate. The data thus suggesting the further weakness in the labour market will not be surprising.
“As we proceed into the final quarter of the year, market conditions are set to become more challenging. The aggressive interest rate hikes, the decline in the value of sterling against the dollar and the rebound in post-COVID demand phasing out, all amidst the ongoing cost of living and energy crises, all point to an extremely difficult period for Scotland.”
Renewed downturn in permanent placements during October
Permanent placements fall amid growing economic uncertainty
Temp billings decline for first time in 26 months
Pay pressures soften, but remain strong overall
Hiring activity across Scotland fell into decline during October, with both permanent staff appointments and temporary billings contracting, according to the latest Royal Bank of Scotland Report on Jobs survey.
Permanent placements have now fallen in two of the past three months, while the downturn in temp billings was the first seen since August 2020. Moreover, the rates of contraction were strong overall amid reports of growing economic uncertainty, softening demand conditions and the deepening cost of living crisis.
October data also revealed further increases in starting salaries and temp wages. However, rates of inflation continued to ease, signalling a mild waning of pressure on pay.
Permanent staff placements fall solidly
October data highlighted a fall in permanent staff placements across Scotland. After a month of growth in September, the respective seasonally adjusted index reverted below the neutral 50.0 threshold to signal the second reduction in three months.
The rate of contraction was the fastest seen in nearly two years and solid, with recruiters often linking the fall to growing economic uncertainty and the cost of living crisis.
At the UK level, a fall in permanent staff hires was also noted, with the rate of decline similar to that seen in Scotland.
Scottish recruitment consultancies signalled a reduction in temp billings during October, thereby ending a 25-month run of expansion. The rate of contraction was the quickest seen since July 2020 during the initial wave of the pandemic and strong overall. According to panellists, the latest fall was driven by reduced activity at clients.
Across the UK as a whole, temp billings were broadly stagnant after rising in each of the prior 26 months.
Downturn in permanent staff supply fastest in three months
Recruiters across Scotland noted a twenty-first successive monthly fall in permanent candidate availability during October. The pace of decline quickened on the month and was marked overall. Panellists generally linked the latest downturn to skill shortages and increased hesitancy to seek out new roles due to rising economic uncertainty.
The pace of reduction across Scotland was more rapid than that recorded for the UK as a whole.
The supply of temp labour across Scotland fell again during October. Despite being severe overall, the rate of decline was the second-slowest in seven months (after September). Recruiters highlighted a lack of European workers and ongoing skill shortages as factors constraining supply.
As has been the case for the last seven months, the rate of contraction in temp staff availability in Scotland was sharper than that seen at the UK level.
Starting salary inflation softens further in October
Latest survey data indicated that average starting salaries for permanent staff in Scotland increased at the slowest pace since June 2021 during October. That said, the pace of wage inflation remained elevated in comparison to the historical average. According to anecdotal evidence, skill and candidate shortages continued to drive up rates of pay.
Data for the UK as a whole also signalled a softer rise in starting salaries during October. Moreover, the pace of inflation was softer than that seen for Scotland for the first time in four months.
As has been the case for the past 23 months, temp wages rose across Scotland during October. While the respective seasonally adjusted index hit an 18-month low, it signalled a sharp rise overall. Greater competition for scarce candidates was cited as a key driver of the latest increase in temp pay.
At the national level, wages also increased at a much slower rate during October. However, the rate of inflation was quicker than that registered in Scotland.
Demand for permanent staff expands at slowest pace in 20 months
Demand for permanent staff grew sharply during October, thereby extending the current period of expansion to 21 months. However, the respective seasonally adjusted index fell for the sixth month running, with the latest reading edging down to a 20-month low.
Across the monitored job categories, IT & Computing registered the steepest rate of expansion, followed by Nursing/Medical/Care.
Recruiters across Scotland noted a twenty-fifth successive monthly rise in temp staff demand during October. While the rate of growth was the weakest since February 2021, it was quicker than that seen across the UK as a whole.
At the sector level, IT & Computing saw the quickest growth in short-term vacancies, followed by Accounts & Financial.
Sebastian Burnside, Chief Economist at Royal Bank of Scotland, commented: “Labour market conditions across Scotland deteriorated in October, as for the first time since August 2020, both permanent placements and temporary billings contracted.
“At the same time, rates of vacancy growth for both permanent and short-term staff continued to ease. Candidate and skill shortages meanwhile stretched the supply of labour thin, with recruiters also noting that increased economic uncertainty had impacted candidate numbers. Though it does seem that market imbalances are becoming less pronounced, the effect on pay remains strong.
“The data therefore suggest that growing uncertainty about the economy and the cost of living crisis are already affecting the labour market, and could weigh further on hiring decisions for the remainder of the final quarter of 2022.”
Not all households are equally affected by rising prices. New ONS data for the UK released in August divides price indices, expenditure shares, and inflation by income quintile, retirement status, whether or not households have children, and residence type.
As many have anticipated, the households that earn the least are feeling the effects of rising prices most keenly, Chart 1.
Chart 1: Relative CPIH price indices by income quintile, 2005-2022
* Indices are differenced from the index for households in the third quintile (the reference group). Source: ONS
The first quintile (the lowest-earning 20% of households) faced an effective annual inflation rate of 9.8% in June, compared to 9.0% for the middle quintile and 7.9% for the highest.
Resolution Foundation’s forecast estimates that households in the lowest income decile will face inflation of 15% by October, while inflation will be 11% for those in the highest decile. The difference in price indices across the income distribution are not new, but they have spiked this year. From 2013 to early 2022, the price index for the first quintile was about 2 points higher than for the third quintile. By June 2022, that difference had grown to 3.5 points.
In comparison, the cost-of-living crisis has impacted the highest earners least.
Household spending patterns drive different effective inflation rates across the income distribution. Food, fuel, and housing make up a larger proportion of spending for lower-income households than for higher-income households.
The largest contributors to rising inflation are housing and household services, transport, and food and (non-alcoholic) beverages. The share of expenditures on these categories falls as income increases, Chart 2.
Chart 2: Expenditure shares on selected categories by income quintile, Feb-Dec 2022
Source: ONS
This year, fuel, food, and transport comprised 64% of the expenditure of the lowest-earning quintile. The highest quintile spends 55% of expenditures on the same categories. Lower-income households are also more likely to use pre-payment meters, and cannot spread costs across the year. High energy prices are more likely to result in reduced consumption during the winter for these households.
How does inflation affect real incomes?
Price inflation erodes real disposable incomes. In August 2022, the Bank of England estimated that real post-tax incomes will fall by 1.5% in 2022 and by 2.25% in 2023. In a recent report, the Resolution Foundation concluded that rising inflation will wipe out twenty years of real earnings growth.
These effects are not evenly felt across the earnings distribution.
In addition to facing higher inflation, the lowest-earning households have seen a drop in year-on-year nominal earnings growth this year compared to higher-earning households. This slower wage growth will compound the effects of higher experienced inflation.
Cost-of-living for retired households and households with children
Household composition may also change how households experience changes in the cost of living, also due to differences in the composition of expenditures.
Retired households typically face higher inflation than non-retired households, Chart 3. The inflation rate for retired households has been about 0.4 percentage points (pp) higher than for non-retired households since March. This trend highlights concerns about pensioners rationing fuel this winter.
Chart 3: Inflation by household composition
Source: ONS
Unlike retirement status, whether or not a household has children does not materially change the inflation rate they face.
Cost-of-living for renters and homeowners
Housing costs contribute to rising inflation, but the rates faced differ by residency type, Chart 4.
Chart 4: Relative CPIH price indices by resident type
* Indices are differenced from the index for owner-occupier households (the reference group). CPIH indices include housing costs. Source: ONS
Similarly to price indices across the income distribution, the price index for social rented sector tenants has spiked in 2022 compared to private rented sector tenants and owner-occupiers.
In June 2022, inflation for social rented sector tenants was 11.2%, compared to 8.2% and 8.6% for other renters and owner-occupiers respectively.
The most likely driver of this difference in experienced inflation is food costs rather than housing; social rented sector tenants spend 16.3% of expenditures on food and non-alcoholic beverages. The same share is about 10% for other renters and owner-occupiers.
Subsidised renters spend a smaller share of their expenditures on housing, fuels, and transport, so these are not likely sources of the difference in inflation rates. Regardless, subsidised renters are likely to be relatively low-income, and concerns about reduced food and fuel consumption, particularly in winter, are still salient.
Rising rent and mortgage rates are also likely to exacerbate pressure on household budgets, particularly for new homeowners.
Do proposed policies to combat the cost of living address distributional inequalities?
Both the UK and Scottish governments have announced policies to tackle the cost-of-living crisis, but it remains to be seen if these policies will effectively target those most impacted by inflation.
The £2,500 price cap announced by the UK government in September is guaranteed for two years and applies to all households equally. A £400 discount on energy bills starting in October and the cancellation of green levies on fuel are also universal.
A £15 billion support package announced in May provides one-off payments of £650 to low-income households on certain types of benefits, £300 to pensioner households, and £150 to individuals on disability benefits.
Scottish Government has also recently announced policies that target the most vulnerable households. Initiatives include a rent freeze and a hold on increases to ScotRail fares. The rent freeze in particular may help some in the short-term, but is likely to reduce rental property supply and quality if not carefully implemented.
Some previously-planned policies, such as increasing the Scottish Child Payment from £20 to £25 per week, per child and extending the benefit to under-16s, will also help households with children to manage rising costs.
The full distributional effects of the the cost-of-living crisis and the UK and Scottish governments’ response remain to be seen.
How the new interest rates affect house prices and rent across the UK
Housing market: hurry if you’re selling, halt if you’re buying, stay if you’ve borrowed, finance experts advise
Landlords will likely increase rent prices or sell to cope with increased mortgage repayments
Inflation and interest rates will keep rising, but house prices are already slowing down
TODAY, the Bank of England will decide what the new base interest rates might be, currently at 1.75%. Top market analysts expect this to further rise to 2.25%.
The Office for National Statistics announced on August 17th that UK inflation rose to 10.1%, from 9.4% two months earlier. The Bank of England expects it to further increase, peaking at 13.3% in October. The accompanying higher interest rates and bleak two-year economic outlook generally means bad news for homebuyers, landlords and renters across the UK.
Top market analysts at CMC Markets expect interest rates to further rise to 2.25% this month. This directly impacts mortgages on variable rates – around 1 in 5 households in the UK – and another 3.1 million whose fixed-rate periods expire in 2022-2023, according to UK Finance estimates.
Borrowers whose repayments are directly linked to the base rate, as set by the Bank of England, will now face mortgage repayments at rates between 3% and 4%, up from 1.75% and 2.75% only five months earlier. This will inevitably spill into rent prices.
CMC Markets analysed the latest data for June 2022 from HM Land Registry, published on August 17th, and concluded that the likely tendency for house prices is in a temporary slowdown, which is good news for those waiting a little longer to buy a home.
Michael Hewson, Chief Market Analyst at CMC Markets comments: “Houses sold in June 2022 only increased in price by 1% compared to May, whereas, last year, this constituted a much more generous 5.7% surge.
“This is only the first month this year for prices to slow down at such a fast rate, so some caution before jumping to conclusions is advised. Remember, house prices may be slowing down, but they are not decreasing. Importantly, since this is transactions data processed at the time, it does not take into account the big leap in interest rates that the Bank of England announced later that month, let alone the even bigger hike in August.
“Therefore, despite the soaring inflation and rising consumer prices across the board, UK house prices appear to be trailing behind because demand for homes has generally come to a screeching halt. Most buyers are weathering the storm for a few more months at least, while some are also working out how the cost of living crisis will pan out in the medium term so that the new mortgage is not squeezing their pockets beyond their comfort zone.
“For those still keen to get on the property ladder, there are plenty of fixed-rate banking products that can insulate them from the current spiralling interest rates on mortgages. They should, however, prepare for the possibility of being faced with higher-than-expected repayments once the fixed rate period expires, as the new variable rates are at the lender’s discretion. Fixed rates are not a cure-all either, as they may now be set to a higher level to start with.
“The buy-to-let market is equally volatile. Landlords will either pass the increased mortgage repayments onto tenants by increasing their rent or simply sell fast to lock in a better price. Right now though, those already on the property ladder are generally better off staying put rather than moving or re-mortgaging. They would not get a good deal on their old house in this market and may likely end up losing more money overall.”
What did the Bank of England do earlier in August?
The Bank of England explained that the rise in interest rates was necessary due to external pressures which are expected to persist. This means that British firms and residents will continue to feel this weight reflected on rising domestic prices, wages outpaced by soaring inflation, and even higher mortgage repayments, despite the Bank’s attempt to widen the borrowing pool through less restrictive mortgage rules.
Although historic, the Bank’s decision was not a surprise for trading analysts at CMC Markets, a London-headquartered financial services company, who believe the Bank was expected to raise interest rates higher than 1.25% during the June meeting, as a means to keep import inflation in check.
This is on the backdrop of a 10% year-to-date depreciation of the British pound sterling against the US dollar and an indication from the Federal Reserve, the US central bank, of a further interest rate increase by 0.5% or 0.75% in September.
Michael Hewson comments: “The UK currently fares worse than both the EU and the US. This is due to its closer dependence on energy shocks than the States and less government intervention to soften the blow compared to its European counterparts.”
What’s next and when will things calm down?
Other than adjusting the interest rates to the accurate level to keep abreast of import inflation, the economic projections for the UK paint a bleak outlook for the next two years.
The UK is projected to enter a recession in the final quarter of this year, the Bank of England announced. The country’s economy will contract by 1.25% in 2023 and 0.25% in 2024, however, inflation is becoming a much bigger long-term threat, with unrealistic chances of falling back to the desired 2% much before 2024.
The current political race for the Conservative Party leadership and the consequent fiscal policies promoted by the new British government is a major factor to take into account for any inflation, GDP, and unemployment projections and investment decisions.
As it stands with the current measures, inflation is expected to peak at 13.3% in October – a sharper increase than the Bank anticipated in June, originally estimated at 11%. It will continue to rise throughout 2023 only to decline in 2024.
Meanwhile, forecasts for the Consumer Price Index (CPI) are less optimistic now, expected to decrease only to 9.5% in the third quarter of 2023, although the Bank anticipates a sharp fall in prices immediately thereafter.
Selling prices are set to increase to reflect rising costs while real household post-tax income is expected to plunge in 2022 and 2023. The Bank predicted that core prices will peak at 6.5% this year, meaning that, in the following six months, food and energy will constitute more than half of the headline CPI.
The next meeting for the Monetary Policy Committee, where the Bank of England will decide what the new base interest rates might be, is today – September 22nd.


